
An NBA Draft Value Chart is a tool used by teams, analysts, and fans to assign a relative numerical value to each draft pick. Its primary purpose is to provide a framework for evaluating the worth of draft selections, particularly in the context of trades.
Origins and Evolution
The concept of assigning value to draft picks gained prominence in the NFL, notably with the “Jimmy Johnson Chart.” While no single, universally accepted chart exists for the NBA, various models have been developed over the years. Analysts and researchers have created influential charts based on different methodologies, attempting to quantify the expected return of each draft slot by analyzing historical data.


Core Concept
The fundamental principle behind an NBA Draft Value Chart is that not all draft picks are created equal. Picks at the top of the draft are significantly more valuable than those later in the draft. A chart assigns a point value to each pick, with the values generally decreasing steeply at the top and then more gradually as the pick number increases. This allows for a more objective comparison when multiple picks are involved in a potential trade.
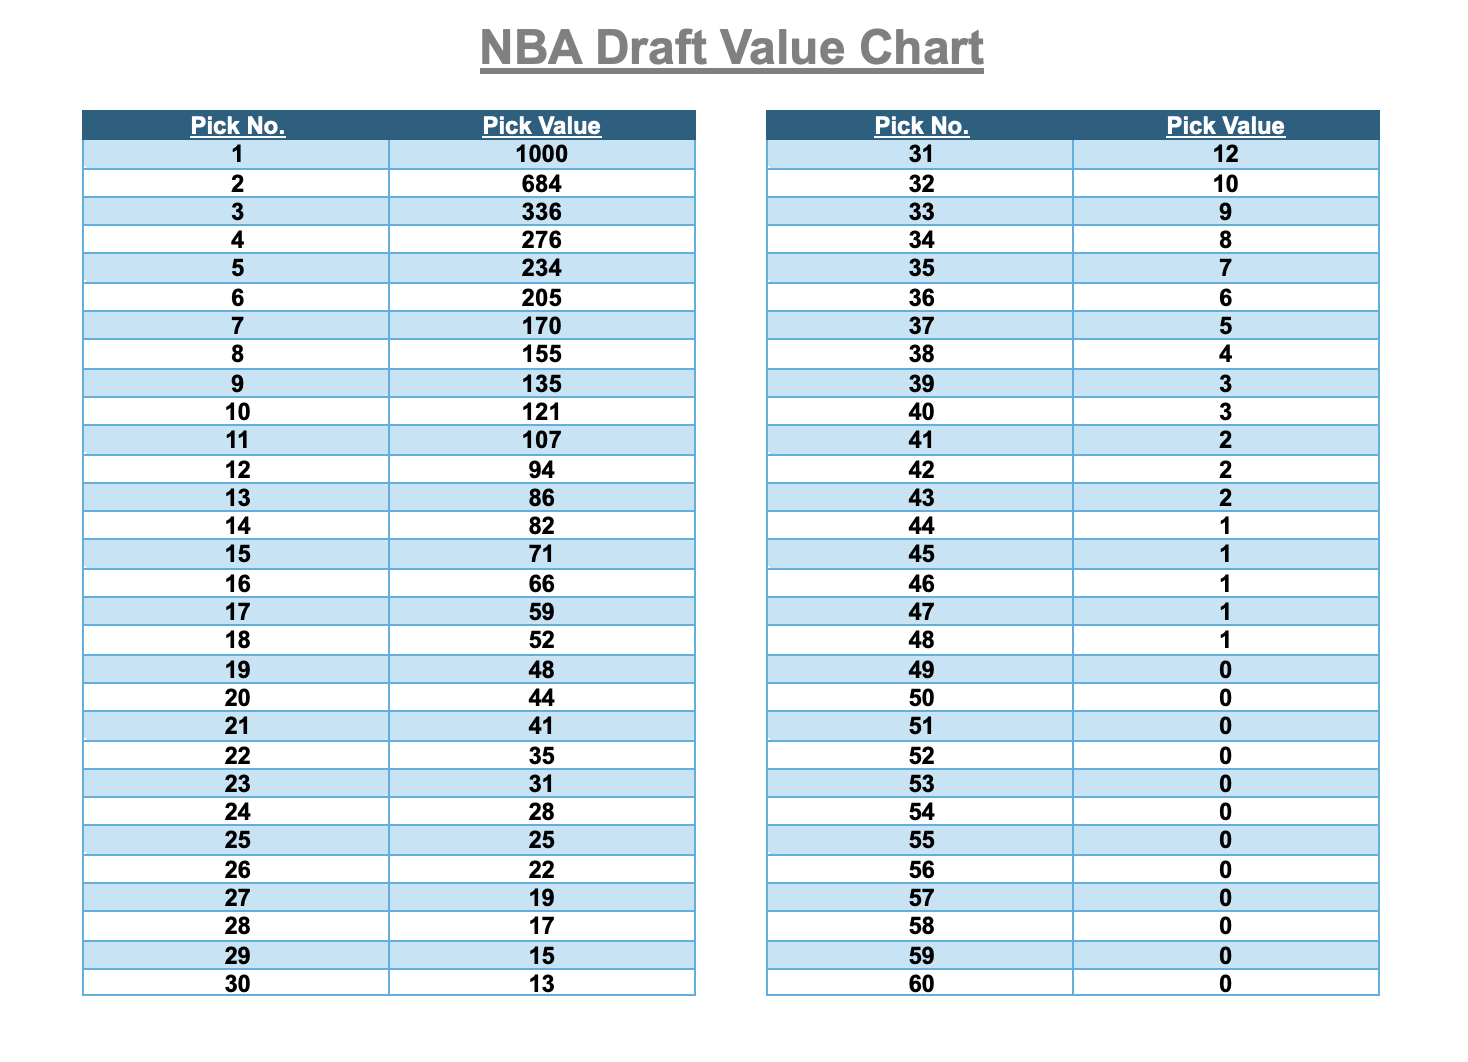
- Higher Picks: Assigned higher numerical values due to a greater historical probability of selecting a star or high-impact player.
- Lower Picks: Assigned lower values, reflecting lower probabilities of acquiring impactful talent, though still possessing value for depth or development.
Methodologies and Variations
Various methodologies are employed to construct NBA Draft Value Charts, leading to different models:
- Historical Performance: Analyzing the past performance metrics (e.g., Win Shares, Value Over Replacement Player (VORP), All-Star selections, contract values) of players selected at each draft slot.
- Salary Slotting & Surplus Value: Considering the NBA’s rookie salary scale and the potential surplus value a player on a cost-controlled rookie contract can provide relative to their on-court production and cap hit.
- Trade-Based Value: Deriving values by analyzing historical trades, observing what teams have empirically been willing to exchange for specific draft picks or packages of picks.
Different models may weigh these factors differently, or use proprietary formulas, leading to variations in the specific values assigned to picks.
Practical Applications
NBA Draft Value Charts serve several practical purposes for front offices and analysts:
- Trade Evaluation: They provide a quantitative baseline for assessing whether a proposed trade involving draft picks is “fair” or advantageous. Teams can sum the chart values of picks being exchanged on both sides to gauge the transaction.
- Draft Strategy: Helps teams understand the relative “cost” of moving up or down in the draft order, informing decisions about consolidating picks or acquiring more.
- Asset Management: Assists in valuing a team’s overall portfolio of draft capital for long-term planning.
Important Considerations and Limitations
While useful, draft value charts are tools with inherent limitations:
- Not Predictive of Specific Talent: Charts indicate average historical value, not the specific talent available in a particular draft year or at a specific pick. The perceived strength and depth of a draft class can significantly alter the actual market value of picks.
- Subjectivity in Construction: The construction of any chart involves subjective choices in methodology, data selection, and weighting of factors.
- Team-Specific Context: A chart doesn’t inherently account for a specific team’s pressing needs, competitive timeline, existing roster, or unique scouting insights on individual prospects. A pick might be more valuable to one team than another.
- “Flat” Tiers in Drafts: Some draft classes may have tiers of talent where several consecutive picks hold roughly equivalent prospective value, which a smooth, continuously declining value curve might not fully capture.
- Market Dynamics: Actual trade values can fluctuate based on supply and demand, the number of teams looking to buy or sell picks, and the presence of “must-have” prospects.
Therefore, these charts are best utilized as a guideline or a starting point for discussion and analysis, rather than an absolute or definitive measure of a draft pick’s worth.


